

In today's data-driven world, businesses of all sizes rely heavily on analytics tools to make informed decisions. One of the most popular analytics tools on the market is Zoho Analytics. With its powerful features and intuitive interface, it has become a go-to choice for many businesses seeking to gain valuable insights from their data. However, despite its many benefits, using Zoho Analytics effectively can be challenging. In particular, data visualization, the process of presenting data in an easy-to-understand format, can be a stumbling block for many users. In this article, we'll explore some of the most common data visualization pitfalls and how to avoid them, so you can get the most out of this powerful tool and make better-informed decisions for your business.
The Importance of Data Visualization
Data visualizations are an essential tool for businesses to better understand and communicate complex information. They help to simplify data and present it in an easily digestible format, making it easier for decision-makers to draw insights and make informed decisions. It can also help businesses identify patterns and trends that may not be immediately apparent in raw data. For example, a line graph can help to show how sales have fluctuated over time, while a scatter plot can help to identify correlations between two variables. Additionally, data visualizations can help businesses to tell a story with their data, making it more engaging for stakeholders. Interactive visualizations can allow users to explore the data themselves, increasing their understanding and engagement with the data.
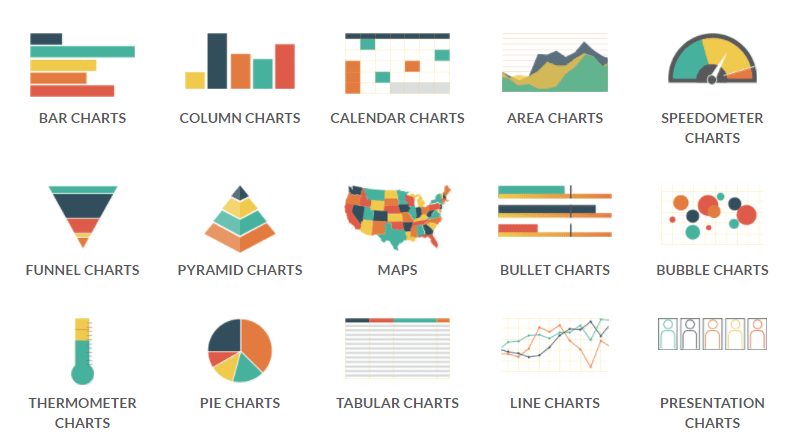
There are many different types of visualizations that you can use to present your data, including charts, graphs, and maps. Each type of visualization has its strengths and weaknesses, so it's essential to choose the right one for your data. When done correctly, data visualization can help you make better-informed decisions for your business. However, when done poorly, it can lead to confusion and misinterpretation of your data.
Common Data Visualization Mistakes
Common Data Visualization Mistakes
1) Overcomplicated Visualizations
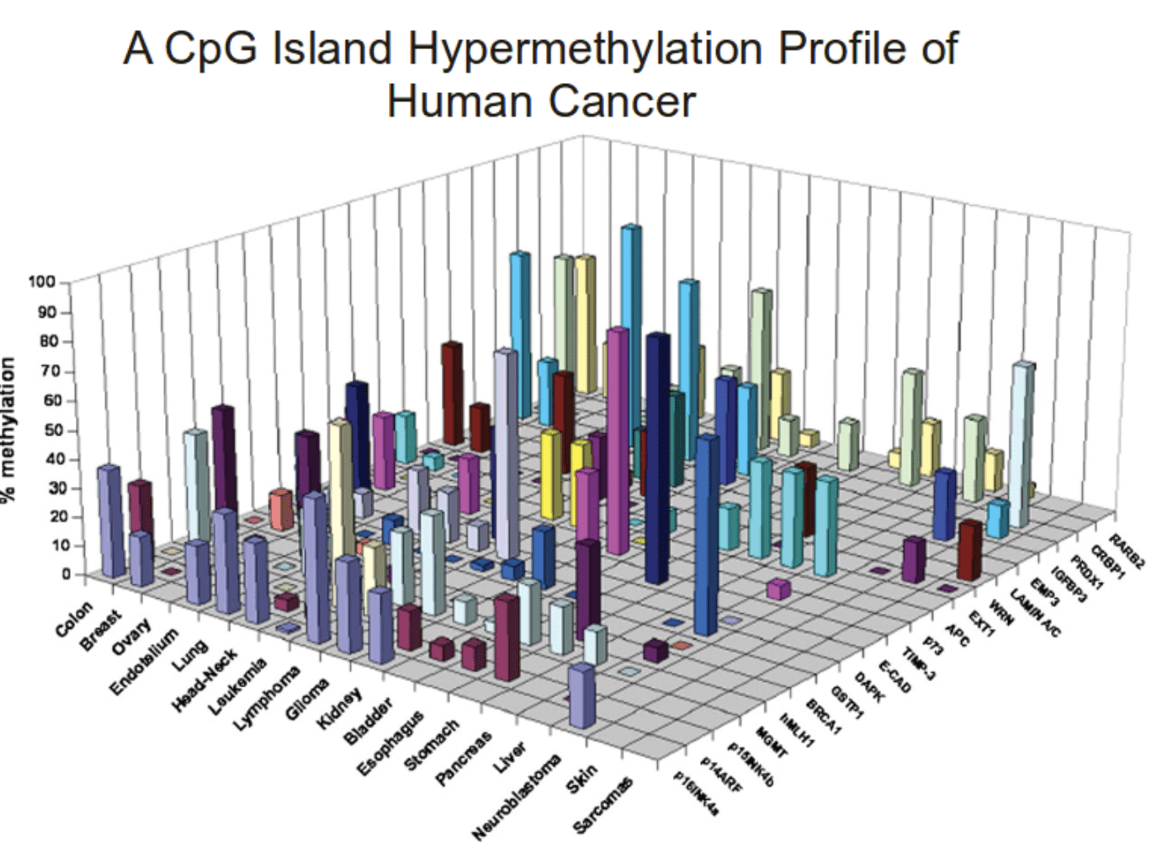
One of the most common data visualization pitfalls is overcomplicating your visualizations. While it's essential to present your data in a way that is easy to understand, it's also crucial not to overdo it. Using too many colors, labels, or data points can make your visualizations confusing and difficult to interpret. To avoid this pitfall, keep your visualizations simple and straightforward. Use only the data points that are necessary to make your point, and avoid cluttering your visualizations with unnecessary information. The example below is simply too complicated to understand immediately. The purpose of your visualizations is to easily summarize the data in an easy way to comprehend for someone that is out of the loop.
2) Wrong Chart or Graph Type
Another common data visualization pitfall is using the wrong chart or graph type. Each type of visualization has its strengths and weaknesses, so it's essential to choose the right one for your data. For example, if you want to show a trend over time, a line chart may be the best option. However, if you want to compare data points, a bar chart may be a better choice. If you're not sure which visualization to use, take the time to experiment with different types to see which one works best for your data.
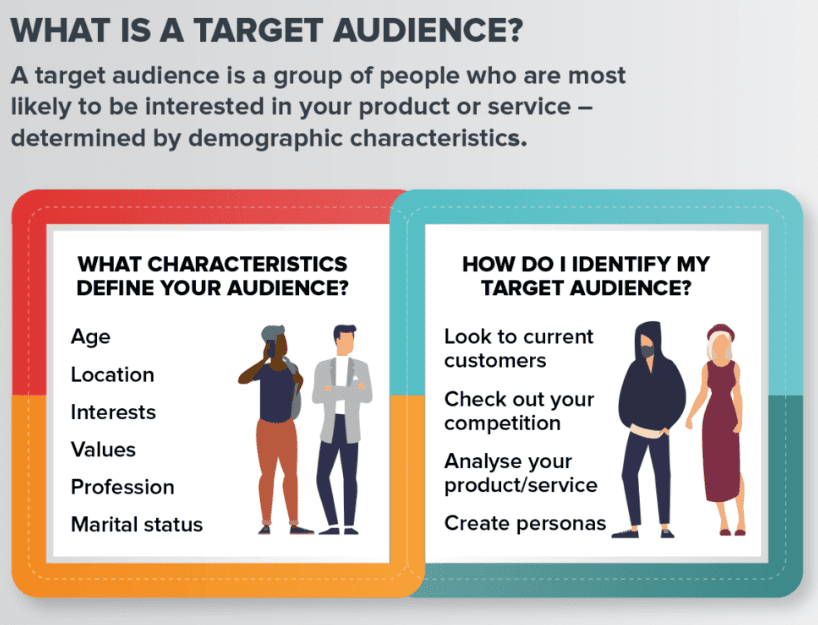
3) Failing to Understand Audience
When creating visualizations, it's essential to consider your audience. What are their needs, interests, and knowledge levels? Failing to understand your audience can lead to confusion and misinterpretation of your data. To avoid this pitfall, take the time to learn about your audience and what they need from your data. If you're presenting to a technical audience, you may be able to use more complex visualizations. However, if you're presenting to a non-technical audience, it's best to keep your visualizations simple and easy to understand.
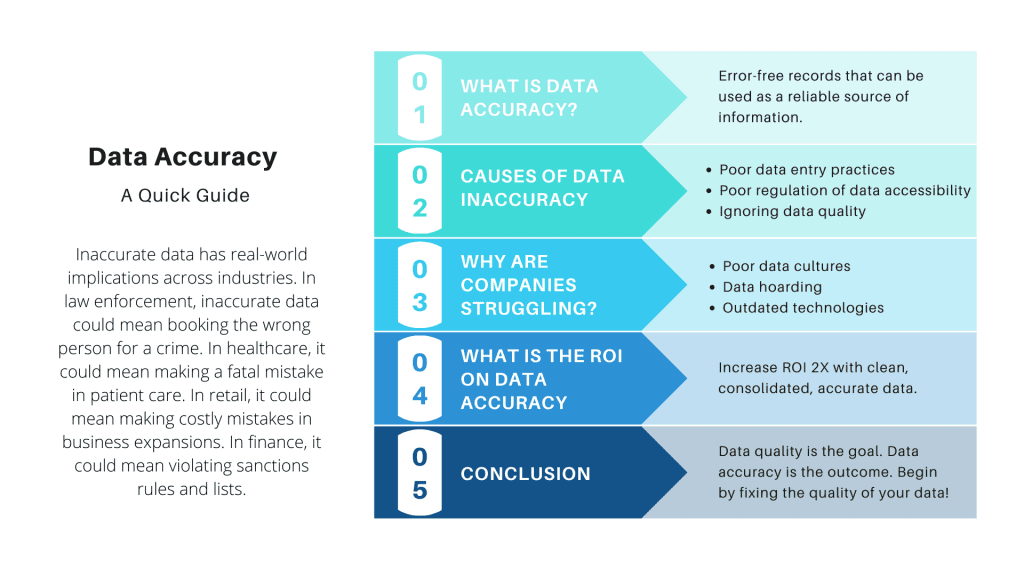
4) No Attention on Data Accuracy
Finally, one of the most critical data visualization pitfalls is not paying attention to data accuracy. Inaccurate data can lead to incorrect conclusions and poor decision-making. To avoid this pitfall, make sure that your data is accurate and up-to-date. Double-check your data before creating visualizations, and make sure that you're using the correct data points.
Effective Data Visualization Practices
Now that we've explored how to avoid common data visualization pitfalls in Zoho Analytics, let's take a look at some best practices for effective data visualization.
- Know Your Audience - Understanding who will be viewing your visualization can help you tailor the design and presentation to their needs.
- Keep it Simple - Avoid cluttering your visualization with unnecessary information. Keep it simple, easy to read, and focused on the most important data points
- Use appropriate charts - Choose the chart type that best represents the data you want to display. Bar charts for comparisons, line charts for trends over time, and scatterplots for correlations
- Color with care - Use color to enhance the visualization but avoid using too many colors or colors that do not have a clear meaning
Label clearly - Make sure to label axes and include a clear title that explains what the visualization is showing.
Provide context - Include enough information to provide the viewer with the necessary context and background information.
Test and iterate - Test your visualization with users and make adjustments based on feedback.
What chart should I use?
Naturally, it varies depending on what you're trying to demonstrate. Line graphs work effectively for change over time (GDP, price of raw materials). Bar graphs are perfect for showing how linked quantities (earnings by department, advertising purchases by medium) correlate with one another. In general, use bar graphs to compare quantities and line graphs to compare times.
Step-by-Step: Creating Charts with Zoho Analytics
1) Upload your data on Zoho Analytics
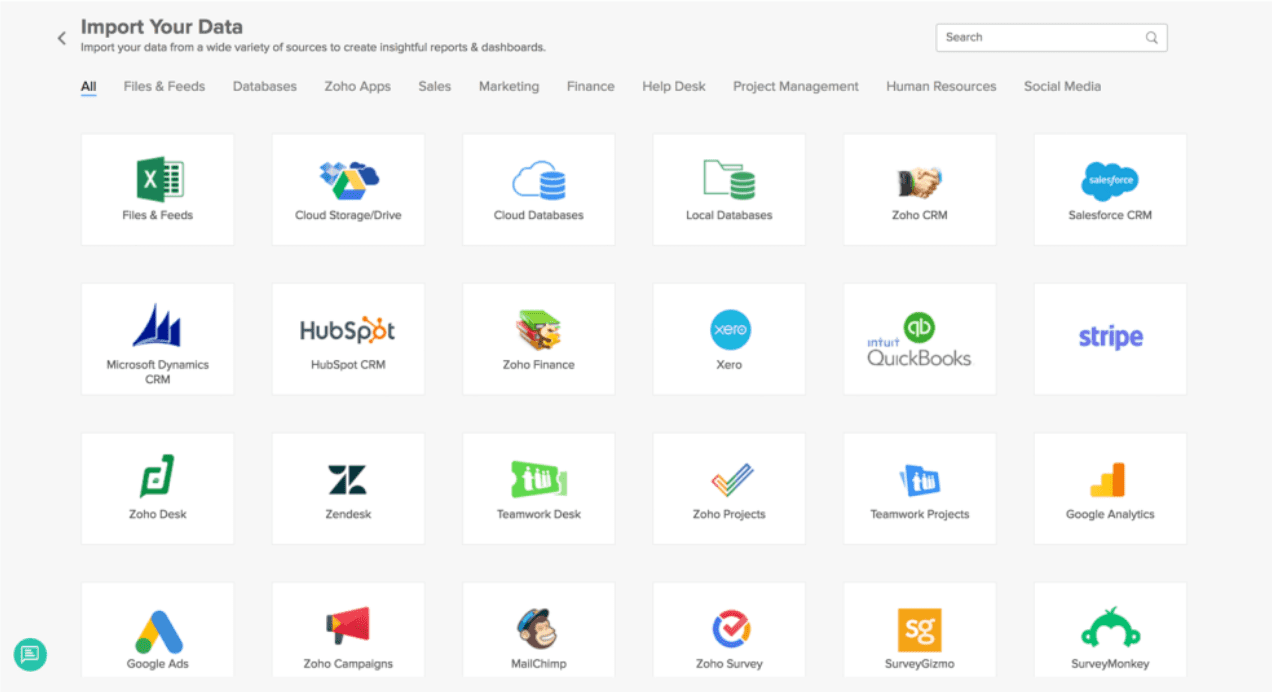
A variant of the popular database language SQL that has been specially tuned for dependable operations at enterprise volume powers Zoho Analytics. This is advantageous because there's a decent possibility your data is stored in a SQL-friendly format.
With support for the majority of SQL dialects, Amazon RDS, Postgres, and more, you can transmit data directly from your company's database to Zoho Analytics. Moreover, discrete data files in many different formats, such as XLS (Excel), CSV, HTML, JSON, XML, plain text files, and more, are accepted. Also, you may pipe data from any URL that offers a data stream, including online storage providers like Zoho Documents, Dropbox, Google Drive, Box, and OneDrive.
2) Create visualizations using Zoho Analytics Tool Kit
After your data has been analyzed, you can quickly create visualizations. One data source can be plotted against time (referred to as a "time series" in the data visualization industry), numerous data sources can be compared, or multiple data sets can be shown evolving over time in a multivariate time series, each with its own Y-axis.
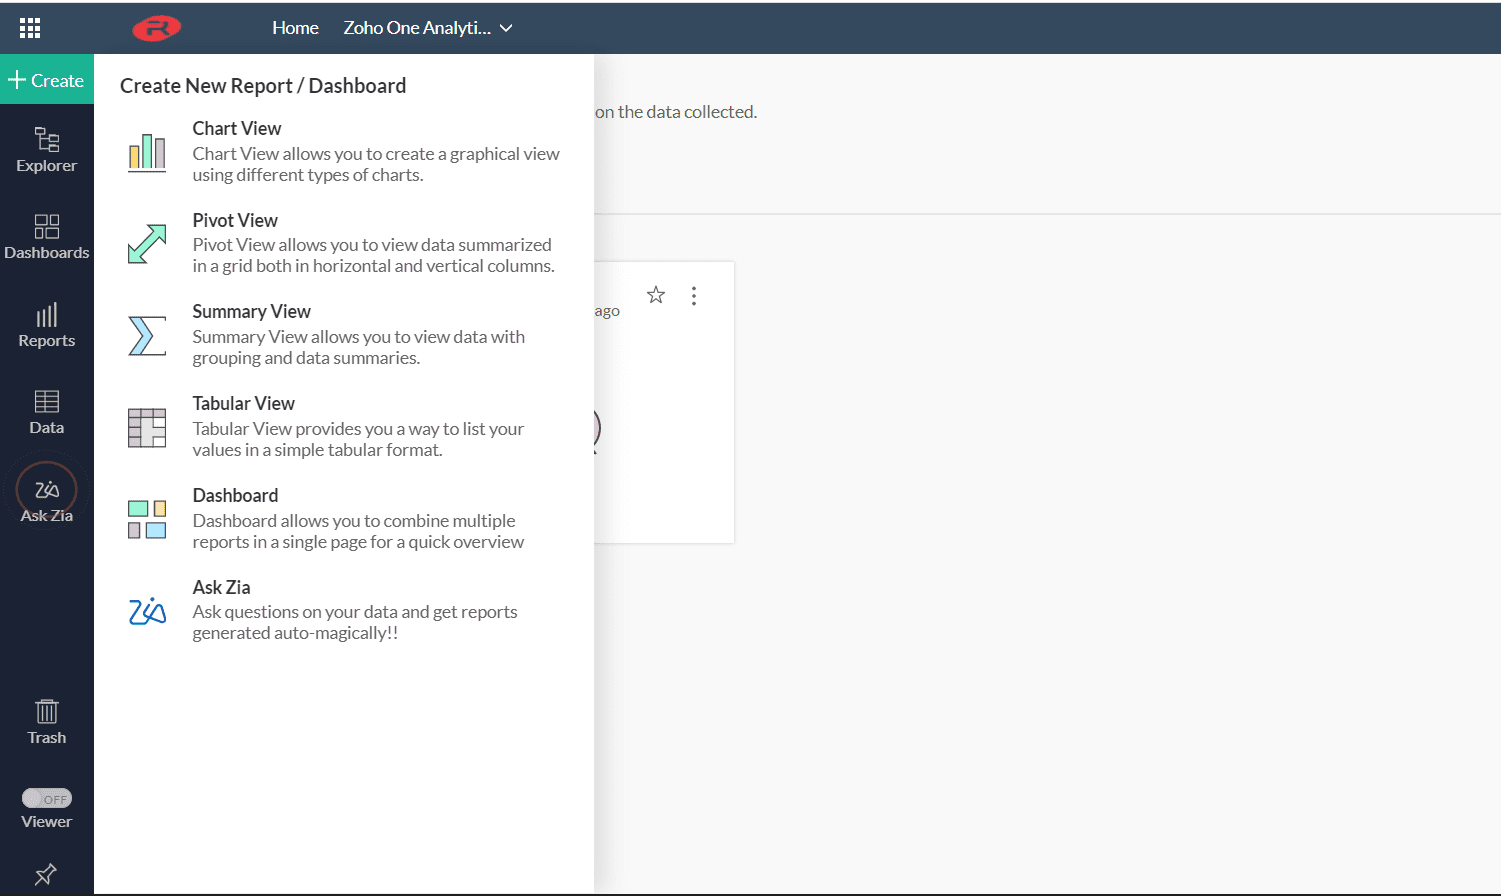
- Click the Create button in the upper left.
- Under Create a New Report, select Create Chart View.
- Drag the necessary data items from the sidebar into the “data shelf”, the area in the top half of the window. You can also tick the checkbox next to the data items, which will automatically place them into the field that Zoho believes is the best fit.
- Click on the Generate button to create your graph.
3) Share your visualizations